Imagine you walk into an executive meeting, armed with your usual charts and reports. The statistics show Product ‘A’ declined but Product ‘B’ increased in 2015. Face-to-face meetings decreased, but new profit increased. While all of those numbers are important, none of that information gives you or your executive team a strong enough picture to make an informed business decision on how to move forward.
Executives and department directors are too often overlooked as possible Geopointe users and benefactors. A geographic perspective will bring your statistical data to life. Using Geopointe’s Map and analytics tools by SpatialKey, invaluable information can be gleaned to give you a better understanding of your business health and areas for growth. Below are examples of 5 data points mapped that will wow any executive team.
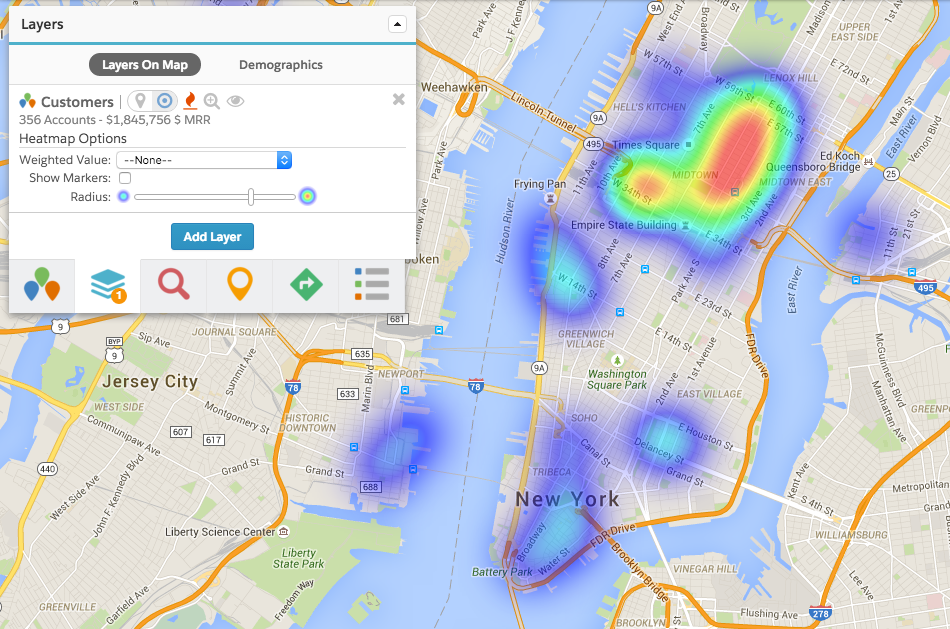
1. Locate Current Opportunity Hot Spots – Heatmaps show concentrations of data with greater accuracy than a clump of map pins. But don’t limit yourself to only using record counts for heat maps. Consider heat mapping by Amount. Don’t forget the power of SpatialKey’s Unique Value Lists, a feature that allows real-time filtering of information based on field values (think Opportunity Stage). The example shows how quickly your data changes when first you filter out closed opportunities, and then heat map the open opportunities by the Amount. Keep your eye on Chicago!
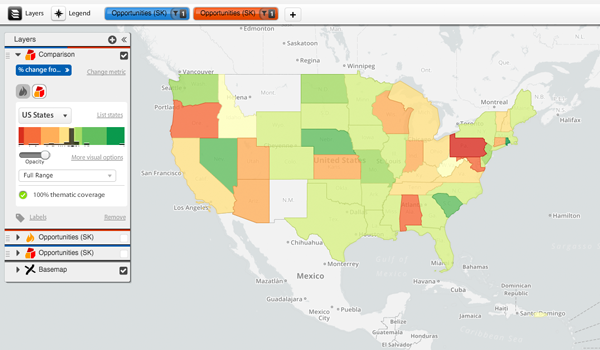
2. Analyze Year-over-year Change – Monitoring increase and decrease over time is important to any company’s success. SpatialKey makes this simple with comparison maps. When two years of data is tied to geographic boundaries, comparison maps will show the increase or decrease in those geographic areas. Instantly, you can see areas of decline against the areas of increase (and wonder – what happened in Pennsylvania?).
3. See Concentrations Over Geographic Areas – Thematic mapping is a powerful tool for seeing concentrations at a glance within important geographic boundaries. The comparison map above is high-level, looking at states. But you can drill down to the zip code level, or use your own shapefiles. The example below shows the concentration of Opportunities in Manhattan, clearly focused in Midtown. A quick glance at this analysis sparks an action plan to target Downtown leads.
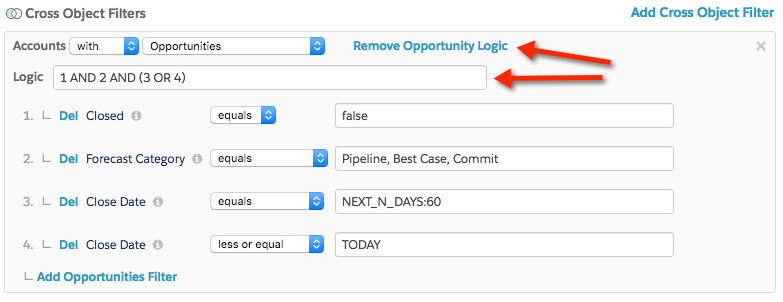
4. Filter to Find the Low-hanging Fruit – Cross-object filtering is a robust data set option frequently underutilized. Imagine your Sales Director has asked for a list of existing accounts to target for an upsell. Use a cross-object filter on the Map page to seek for large customers you haven’t recently closed a deal with. The below image shows possible results. First, the data set is filtered to customers with more than $10k lifetime revenue. Then, the cross-object filter looks for customers without opportunities last year. Export the results (maybe even assign them regionally) and now you have a perfect call list for Sales or Business Development to share with that Director.
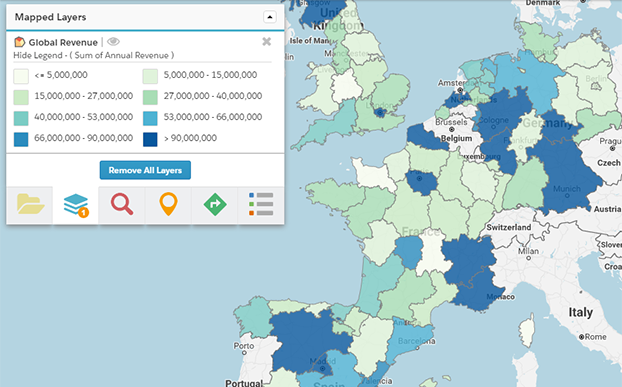
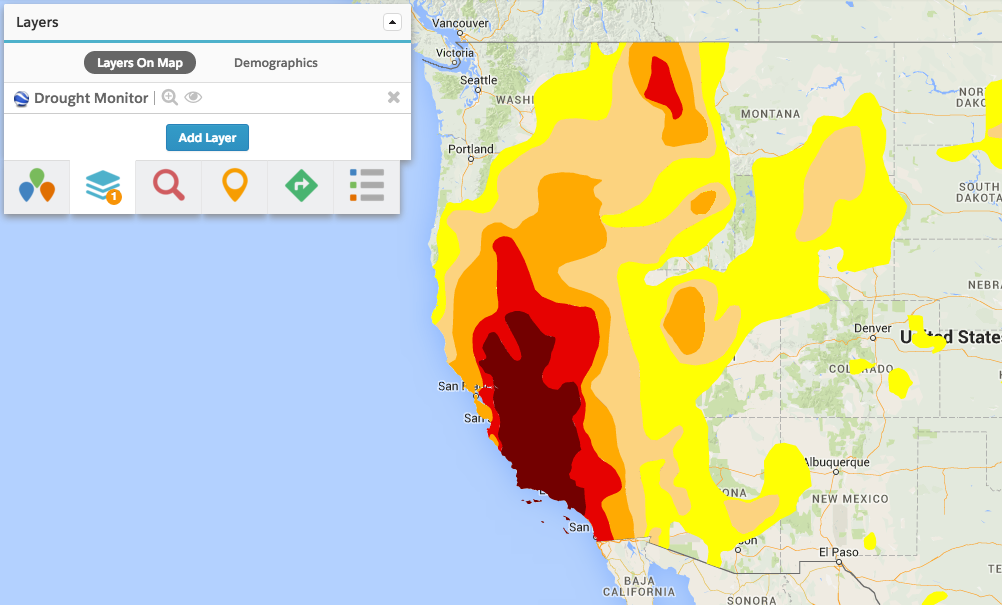
5. Use External Data to Analyze Your Data – Often external factors make an impact on your business. It can be difficult to tie those stats to your stats. However, when viewed geographically, it becomes easy to see how external conditions could have affected revenue. The below example compares a map of ranches (colored by profit increase) to an external layer of the US Drought Monitor. Without it, it might seem strange that profits were down for all California ranches. With it, it’s clear why California ranchers would have a lower than average output.
Your Salesforce data is rich with information. Reports and Dashboards go a long way to showing the information any executive needs to see. But with Geopointe and these 5 key data points, you can take it one step further, and make your data come to life.
As always, you can start a 15-day trial with Geopointe, and our Customer Success will happily walk you through how to create any of the scenarios above. If you are a current user, you can request a SpatialKey trial as well – just ask!


