Polygons, or shapes, offer an innovative method of searching for and managing data on the map. Geopointe offers many ways to search through and filter against your Salesforce data, including multiple search types and advanced filtering capabilities. The shape search provides the ability to draw shapes, search within those shapes, and use shapes to manage data. This post will provide a brief overview of how to create and manage shapes, and how to utilize shapes to search for and manage Salesforce records.
No time to read? Check out the short (3 minute) video at the end of this article!
Background
Some situations require more precise tools to search for your desired data. For example, attempting to find records which do not share any common parameters would be very difficult with field filtering alone. Radial searching works well in most cases, but sometimes a circle is not the right shape to find the data you need. When a circle doesn’t fit, and you can’t find the right parameters against which to filter, your ideal search results are as easy as drawing a shape!
Shapes can be drawn and edited easily. Once created, a shape may be used for a single search, or can be saved for reuse. Geopointe also offers a library of pre-defined shapes such as national boundaries, states, provinces, zip/postal codes, and counties, to name a few types of available data.
Drawing a shape
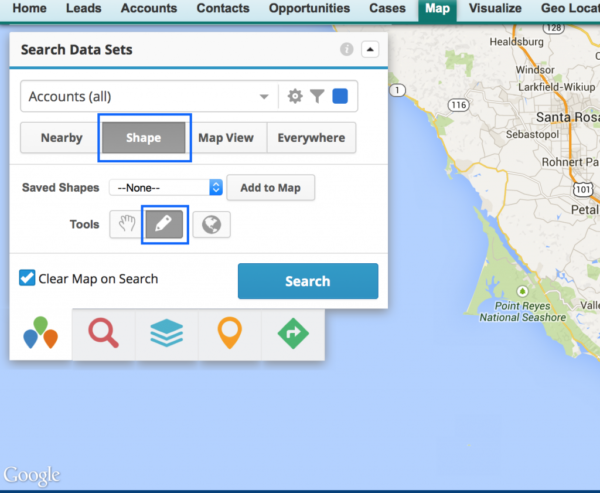
To search with a hand-drawn shape, start by drawing your shape on the map. In Geopointe, select the Shape button and then click on the pencil icon.
Click anywhere on the map to create a vertex. Without holding the mouse button, reposition the mouse and click again. This will add another vertex.
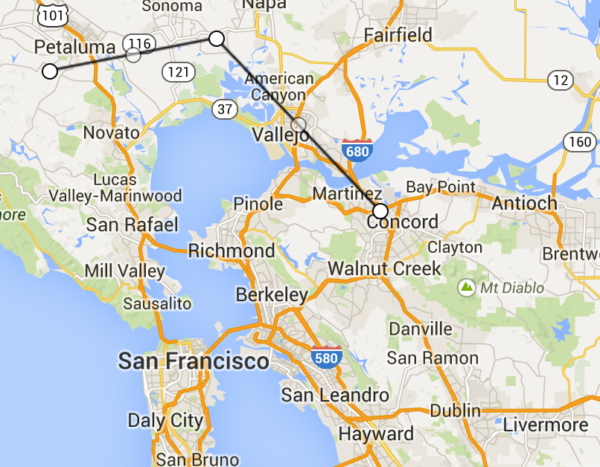
Continue this process until you have arrived back at the first vertex, and click this original vertex to finish your shape.
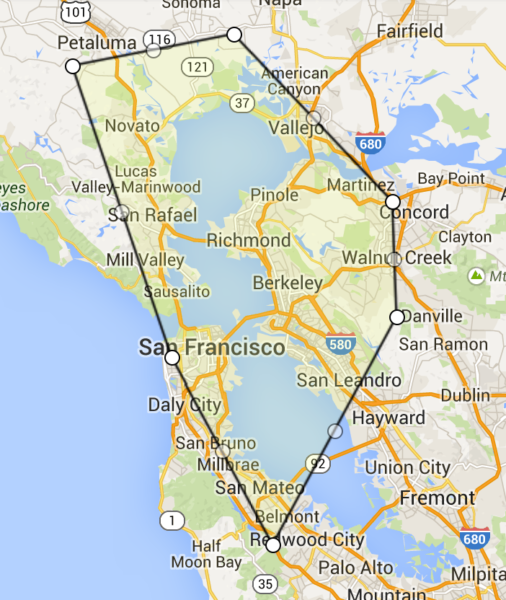
Congratulations! You have created your very first polygon. Now let’s find out what we can do with this new shape-drawing ability.
Right-clicking on the shape boundary exposes a pop-up where the shape’s color is fully customizable. An Actions menu on that pop-up provides additional options. Below we will take a look at each option in the context menu in more detail.
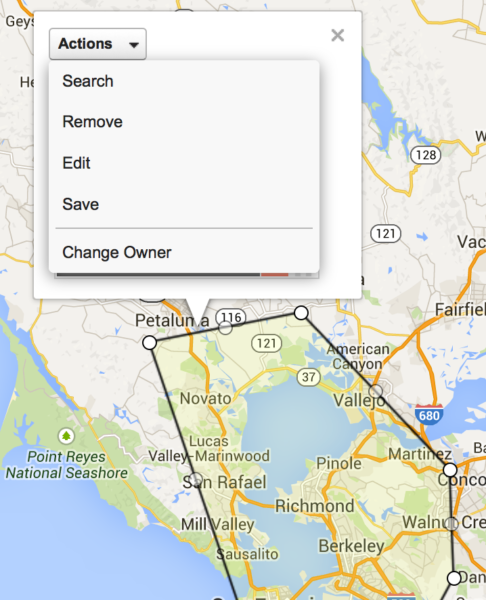
This context menu offers an additional way to interact with a shape.
Search
To search within my newly drawn shape, all I need to do is click on the shape boundary, select Actions, then click Search. A search will be performed against the data set currently selected in the data set drop down menu. Any records which are located within the shape will be returned as results.
Change Owner
In addition to searching for records within the shape, we can now bulk change the owner of records within that shape. This is very handy to reallocate records among sales or support staff with just a few clicks.
Save
Shapes can be used for one-time searches, but often it is handy to save a shape for later use. To do this, click on the shape boundary, navigate to the “actions” menu, and select save. Give the shape a name and description (if desired) and click save. The shape will now be available to add to the map again later.
Layers Menu
Any shapes on the map will appear in the Geopointe layers menu. Saved shapes will appear with their given name, and all unsaved shapes will appear as “unsaved shape”. In the example below, my map is displaying my “Accounts” data set along with my “Bay Area” saved shape. Notice that the shape automatically calculates the number and type of records present within, and then sums any dollar value fields present. Here we can see that my eight accounts in the Bay Area shape have over $93 billion in total revenue.
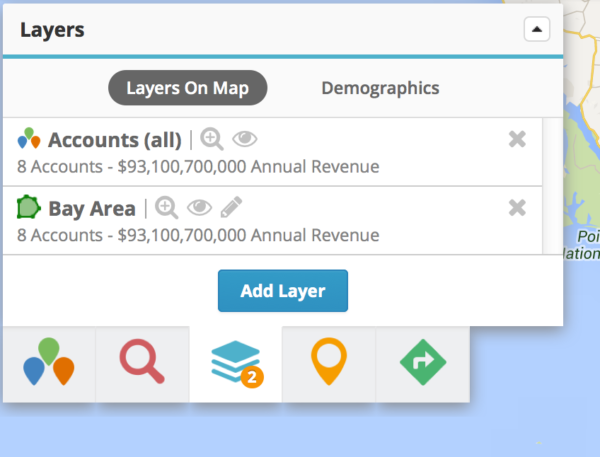
Layers Menu, as accessed via the Layers tab (stack of blue squares).
Displaying a Saved Shape from the Shape Search Menu
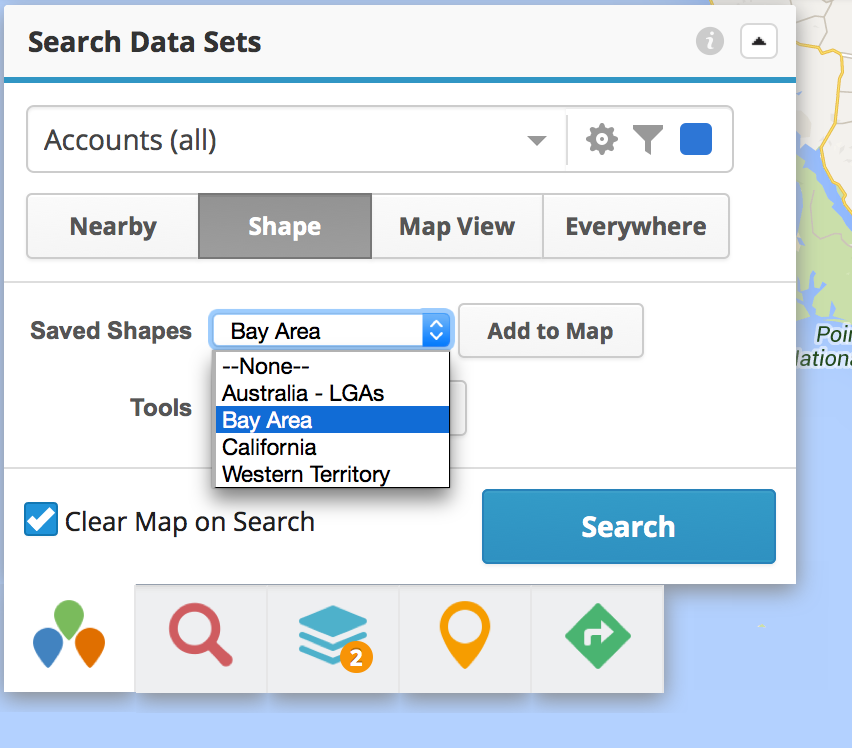
There are two ways to add a shape which has been previously created and saved. The first is via the Data Set window on the map page. Select Shape (just as we did when drawing the shape originally), and then choose the desired shape from the drop down menu and click Add to Map.
Displaying a Saved Shape from the Layers Menu
The second way to add a saved shape is to return to the Layers menu, click Add Layer and select the desired shape to add it to the map.
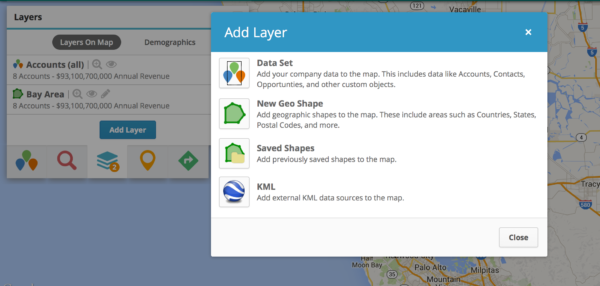
This Add Layer menu also allows shapes to be built using pre-defined shape boundaries provided by our Geodata Specialists here at Geopointe. Geopointe’s Shape Library will be covered in greater depth in a following post.
Please enjoy this brief video overview demonstrating how to create and work with shapes in Geopointe.
